IGV Introduction
Under Development!
This tutorial is not in its final state. The content may change a lot in the next months. Because of this status, it is also not listed in the topic pages.
| Author(s) |
|
| Reviewers |
|
OverviewQuestions:
Objectives:
Time estimation: 2 hoursSupporting Materials:Published: Mar 30, 2016Last modification: Feb 17, 2023License: Tutorial Content is licensed under Creative Commons Attribution 4.0 International License. The GTN Framework is licensed under MITpurl PURL: https://gxy.io/GTN:T00193rating Rating: 2.2 (0 recent ratings, 11 all time)version Revision: 11
Using the Integrative Genomics Viewer
Bioinformatics Galaxy Course
MPI-IE & University of Freiburg
To start IGV, go to the IGV downloads page: https://www.broadinstitute.org/software/igv/download.
User Interface
Main Window
- The tool bar provides access to commonly used functions. The menu bar and pop-up menus (not shown) provide access to all other functions.
- The red box on the chromosome ideogram indicates which portion of the chromosome is displayed. When zoomed out to display the full chromosome, the red box disappears from the ideogram.
- The ruler reflects the visible portion of the chromosome. The tick marks indicate chromosome locations. The span lists the number of bases currently displayed.
- IGV displays data in horizontal rows called tracks. Typically, each track represents one sample or experiment. This example shows methylation, gene expression, copy number and mutation data.
- IGV also displays features, such as genes, in tracks. By default, IGV displays data in one panel and features in another, as shown here. Drag-and-drop a track name to move a track from one panel to another. Combine data and feature panels by selecting that option on the General tab of the Preferences window.
- Track names are listed in the far left panel. Legibility of the names depends on the height of the tracks; i.e., the smaller the track the less legible the name.
- Attribute names are listed at the top of the attribute panel. Colored blocks represent attribute values, where each unique value is assigned a unique color. Hover over a colored block to see the attribute value. Click an attribute name to sort tracks based on that attribute value.
Menu Bar
File
-
Load from File - Displays genomic data from one or more files.
-
Load from URL - Displays genomic data from a file identified by URL.
-
Load from Server - Displays genomic data from the IGV data server.
-
Load from DAS - Displays genomic data from a Distributed Annotation Server (DAS)
-
New Session - Unloads all currently loaded data, as if you exited and restarted IGV
-
Open Session - Opens a previously saved session file.
-
Save Session - Saves your current settings to a named session file
-
Save Image - Saves a snapshot of the IGV window to a graphics file, omitting the menu bar and tool bar. Can save in .png, .jpg, or .svg format.
-
Exit - Closes IGV.
Genomes
-
Load Genome from File - Loads a genome into IGV from your file system.
-
Load Genome from URL - Loads a genome into IGV from a web URL.
-
Load Genome from Server - Loads a genome into IGV from the IGV data server.
-
Create .genome File - Save your genome file in .genome format.
-
Manage Genome List - Choose which genomes to display in the genome drop-down menu in the tool bar.
View
-
Preferences - Opens a tabbed menu of data display preferences.
-
Color Legends - Displays color legends for track data, which may be modified.
-
Show Name Panel - Shows/hides the track name panel.
-
Set Name Panel Width - Resets the track name panel width.
-
Show Attribute Display - Shows/hides attributes and attribute values.
-
Select Attributes to Show - Shows/hides selected attributes and attribute values.
-
Show Header Panel - Shows/hides the chromosome location header panel.
-
Reorder Panels - Allows the user to reorder the display panels.
-
Go to - View and select loci visited in your navigation history.
Tracks
-
Sort Tracks - Sorts track data.
-
Group Tracks - Groups track data.
-
Filter Tracks - Filters track data.
-
Fit Data to Window - Sets the track height to display all of the data, or as much data as possible.
-
Set Track Height - Sets the track height to a specified value.
Regions
-
Region Navigator - Opens the region navigator.
-
Gene Lists - Opens the gene lists window.
-
Export Regions - Saves currently defined regions of interest to a BED file. If no regions of interest are defined, no BED file is created.
-
Import Regions - Imports regions of interest from a BED file.
Tools
-
Run Batch Script - Executes a series of sequential tasks. Users can load at .txt file that contains a list of commands, one per line, that will be run by IGV. The accepted commands are the same as the IGV Port Commands.
-
Run igvtools - Launches the igvtools interface window.
-
Find Motif - Search for a particular nucleotide sequence in the reference genome.
-
Gitools Heatmaps - Data and results are represented as browsable heatmaps. Data can be exported from IGV in gitools format, or loaded directly into a running gitools session. See http://www.gitools.org for details.
-
BEDTools - A fast, flexible suite of tools used to compare sets of genomic features. IGV uses BEDTools to compare features in loaded tracks, and view the results as a new track.
GenomeSpace
-
Load File from GenomeSpace - Load a file into IGV from your GenomeSpace directory.
-
Load Genome from GenomeSpace - Load a genome into IGV from your GenomeSpace directory.
-
Save Session to GenomeSpace - Save current IGV session to your GenomeSpace directory.
-
Load Session from GenomeSpace - Load a previous session from your GenomeSpace directory.
-
Logout - Log out of GenomeSpace
-
Register - Register a new account at GenomeSpace
Help
-
User Guide… - Displays the IGV User Guide.
-
Help Forum… - In your default web browser, opens the home page for the igv-help forum.
-
About IGV - Displays IGV version and build number.
Tool Bar
- Loads a genome.
- Zooms to a chromosome.
- Displays the chromosome location being shown. To scroll to a different location, enter the gene name, locus, or track name and click Go.
- Zooms to whole genome view.
- Moves backward and forward through views of the genome like the back and forward buttons in a web browser.
- Refreshes the display.
- Defines a region of interest on the chromosome.
- Reduces the row height on all tracks to fit all data for the region in view into the window; will also expand tracks (to their maximum preferred size) to fill the view, if needed.
- Toggles the pop-up information windows in IGV on or off.
- Zooms in and out on a chromosome.
Pop-up Menus
To select tracks and display the pop-up menu, do one of the following:
-
Right-click a track to select it and display the pop-up menu.
-
Right-click an attribute value to select all tracks with that attribute value and display the pop-up menu. Tip: Keep in mind that right-clicking an attribute may select tracks that are not visible in the data panel. Scroll down the data panel to view all the selected tracks.
-
Control-click track names (Mac: Command-click) to select the tracks, then right-click one of the selections to display the pop-up menu.
Commands in the track pop-up menu change the display options for the selected tracks. Most changes made via the pop-up menu are lost when you exit IGV unless you save the session. In a few cases, changing the pop-up menu also changes an option in the Preferences window; these changes are persistent.
Using IGV: Examples
LOOKING AT ENCODE RNA-SEQ DATA
-
Open IGV (.igv.sh from command line)
-
Load the human genome : In the toolbar, Click Genome > Load Genome from Server > Search and select Human (hg19)
-
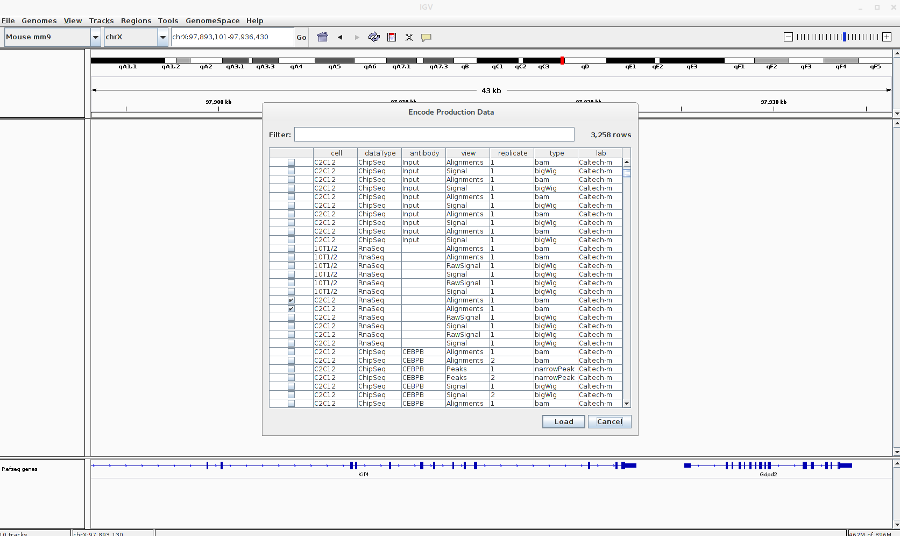
Load the encode RNA-Seq BAM files: Go to File > Load from ENCODE > Select C2C12 RNA-Seq BAM files (See image in the Pdf)
-
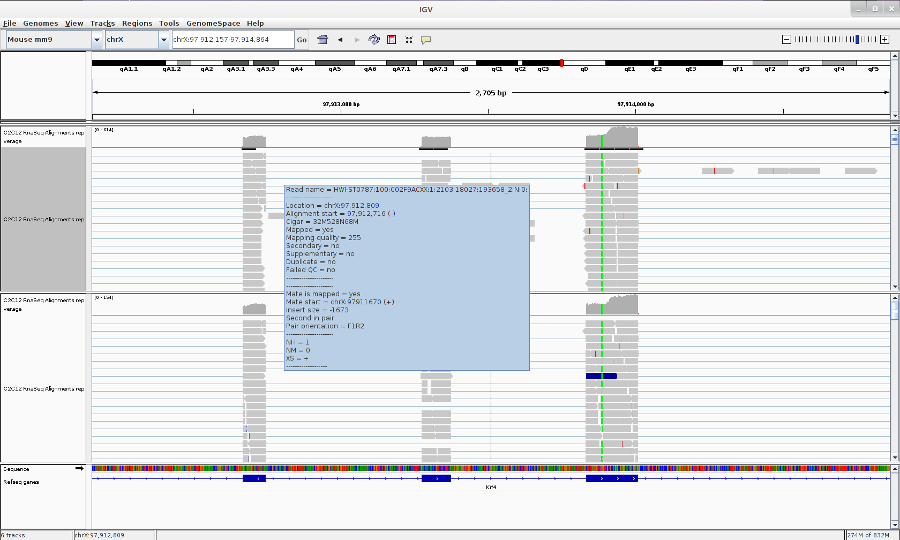
Go to your favorite location in the genome by entering the location in the Search box, zoom in to the reads by using Zoom button.
-
You can change the track properties by right-click on the track. Select View as pairs to see the left and right pairs of paired-end reads.
- You can make a sashimi plot to see reads aligning to each junction. Right-click > Sashimi plot.
- Save what you see by going to File > Save Image.
LOOKING AT ENCODE ChIP-Seq DATA
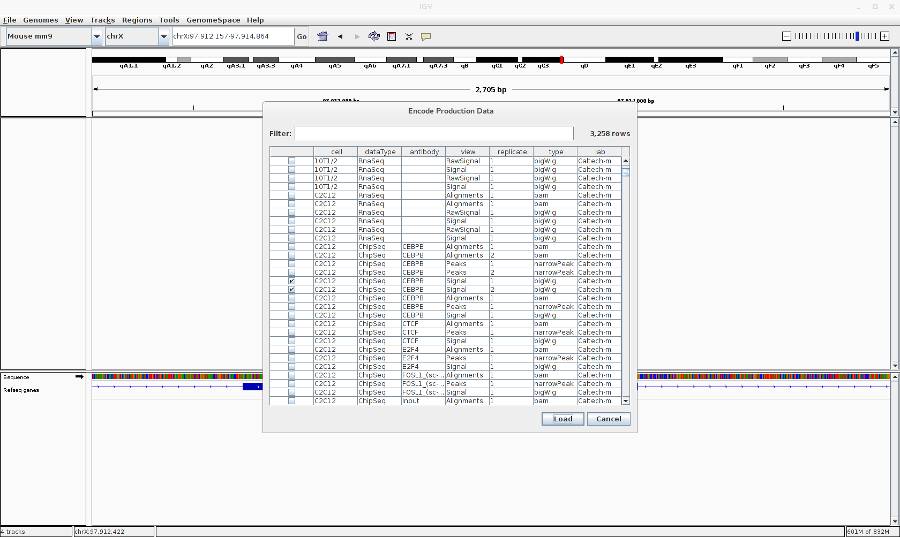
- Go to File > Load from ENCODE > Select C2C12 ChIP-Seq bigwig files
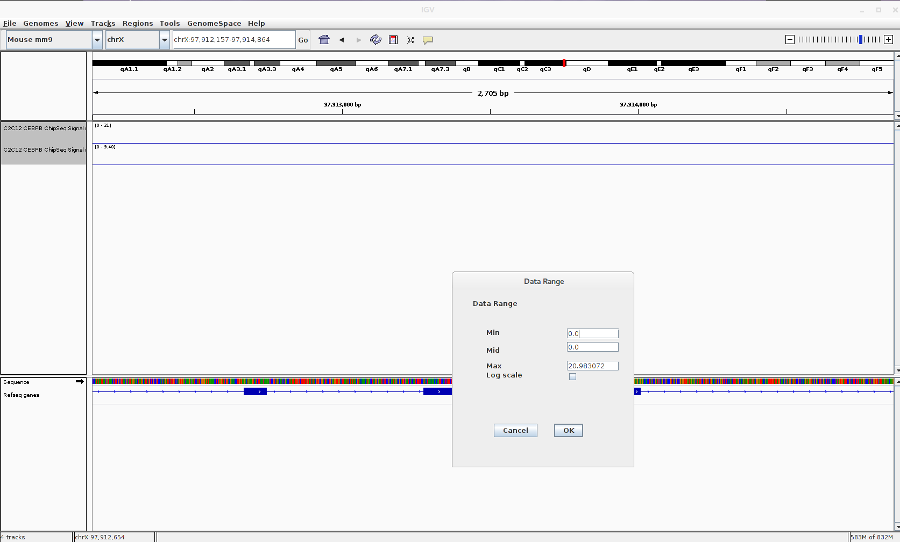
- Reset the track heights to make them comparable. Right click on the track > Set data range. Then change the scale.
-
You can also change the track colors, name and chart type (line,bar,heatmap).
-
Save the image (File > Save Image)
POPULAR FILE FORMATS THAT YOU CAN LOAD IN TO IGV
-
BAM
-
BED
-
BedGraph
-
bigBed
-
bigwig
-
FASTA
-
GFF/GTF
-
MAF
-
SAM/BAM
-
VCF
-
PSL
-
Narrowpeak
-
Many more
SOME OTHER THINGS YOU CAN DO
-
Take multiple images from regions in a bed file. First make a batch file from the bed file using bedtools (bedtoIgv). Then load the script in Tools > Run Batch Script.
-
Find a given motif. Tools > Find Motif.
-
Set startup preferences. View > preferences.
-
For more, have a look at the IGV documentation.
FOR IGV HELP AND DOCUMENTATION
GOTO: https://www.broadinstitute.org/igv/ or Click on Help in IGV menu.


