New Tutorial: Visualization of RNA-Seq results with Volcano Plot in R

Author(s) orcid logoMaria Doyle avatar Maria Doyle
new tutorial visualization

Posted on: 26 June 2021 purlPURL: https://gxy.io/GTN:N00018

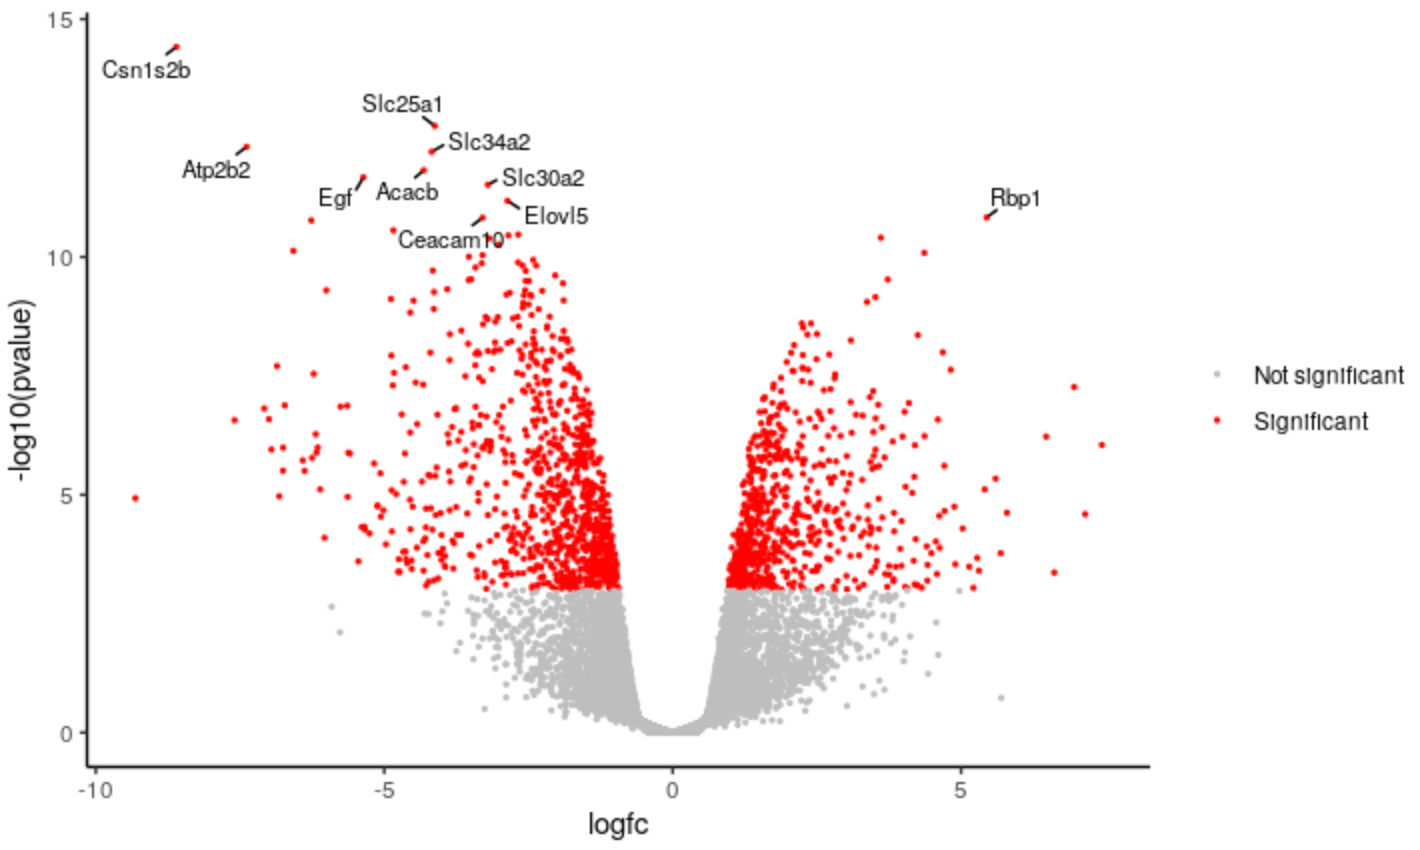
The Volcano plot tutorial introduced volcano plots and showed how they can be easily generated with the Galaxy Volcano plot tool. This new tutorial shows how you can customise a plot using the R script output from the tool and RStudio in Galaxy. A short video for the tutorial is also available on YouTube, created for the GCC2021 Training week. Happy plotting!

View Material
Screenshot of Volcano Plot customised in R. Significant genes had their colour changed to red, and points and labels were made smaller.

Recent News

See all news

Perfectly FAIR Training!

13 May 2024   gtn infrastructure

We are happy to report that over the years of our fruitful collaboration with ELIXIR TeSS, all GTN materials should receive a perfect score on the FAIR-Checker.

Learn to use MINERVA Platform's COVID-19 Disease Map with Galaxy

28 March 2024   by-covid pathways minerva gtn infrastructure new feature

As part of the work of BeYond COVID, we have developed a new integration between the MINERVA Platform’s COVID-19 Disease Map and Galaxy! Datasets created within Galaxy can now be seamlessly visualized in the MINERVA Platform, allowing you to explore your data in the context of the COVID-19 Disease Map.