Forests are three-dimensional, but a view from above shows little of what lies below the canopy.
LiDAR (Light Detection and Ranging) scans a forest with laser pulses and records where they hit
vegetation and ground. The result is a point cloud: millions of points, each with a position and
an elevation. To study single trees, for example their height or crown size, we first have to find
out which points belong to which tree. This step is called individual-tree segmentation.
In this tutorial, you will use the 3Dtrees tools (Gerberding and others 2026) in Galaxy to prepare
one drone LiDAR point cloud, predict individual trees with SegmentAnyTree (SAT)
(Wielgosz et al. 2024), and inspect the result in an interactive 3D viewer. The workflow was
built by the 3Dtrees community, and the data are part of the THEIA data hub.
The data were collected by drone over a Mediterranean oak forest near Pic Saint-Loup in southern
France (Alleaume and Jolivot 2021). The dataset has four files, one per flight area. We use only the
smallest, Strip-20210804-150144_D.las (476,9 MB). LAS is a common file format for LiDAR points;
LAZ is its compressed version.
The flights took place in June 2021 with a YellowScan Surveyor scanner on a DJI Matrice 600 Pro
drone, as part of the SENTHYMED/MEDOAK experiment (Adeline et al. 2024). The dates in the file
names record when post-processing finished. The data have about 200–250 points per square metre,
use the RGF93 / Lambert-93 coordinate reference system, and are published under the Etalab Open
License 2.0.
The four files are separate flight areas, not tiles of one survey: A and B do not touch, while C
and D overlap. Processing them together would need extra alignment and overlap checks, which is
why this tutorial uses only file D.
The dataset is part of THEIA, the data and services hub for continental surfaces of the
Data Terra research infrastructure. The
THEIA catalogue collects metadata from thematic and
institutional repositories, including the INRAE repository that hosts this dataset.
This is a 'Choose Your Own Tutorial' (CYOT) section (also known as 'Choose Your Own Analysis' (CYOA)), where you can select between multiple paths. Click one of the buttons below to select how you want to follow the tutorial
Import the data yourself, or start from a prepared history if the import does not work.
Hands On: Import file D
Create a new history for this tutorial.
To create a new history simply click the new-history icon at the top of the history panel:
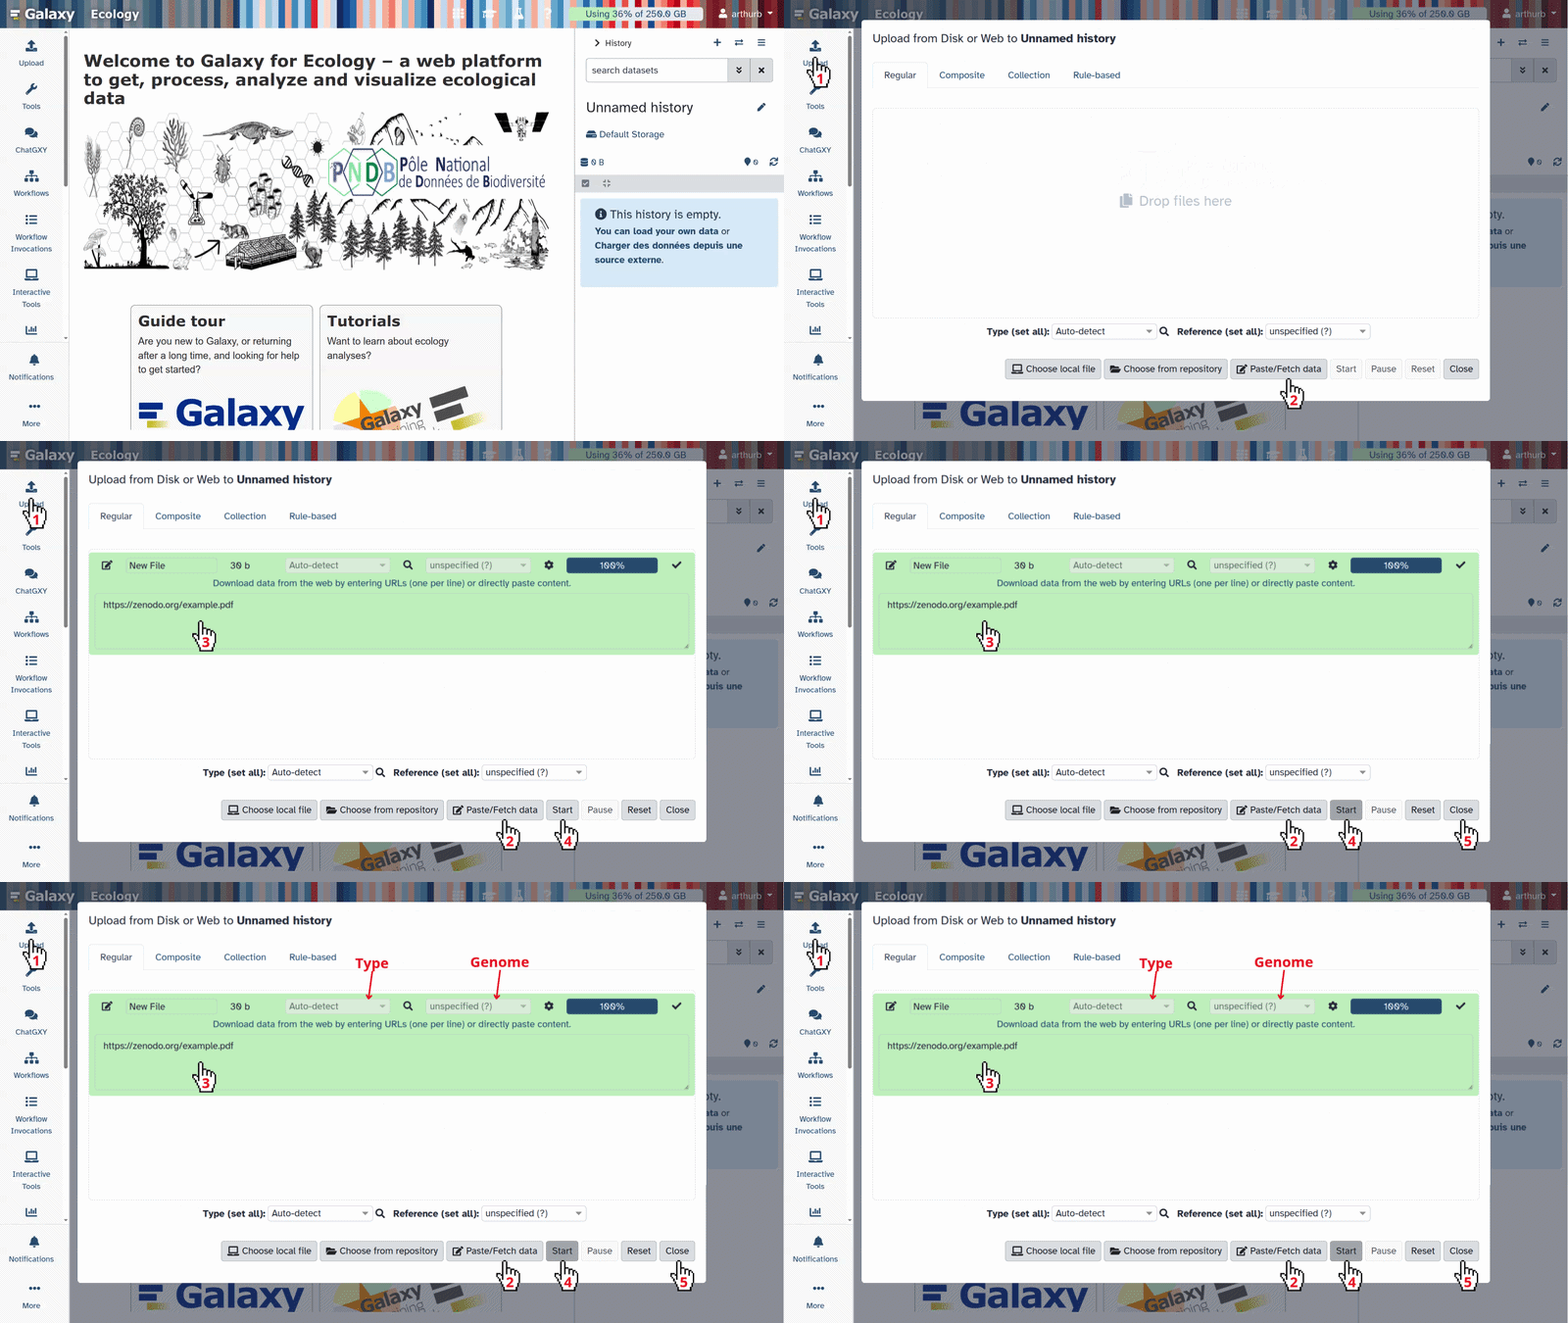
Click galaxy-uploadUpload at the top of the activity panel
Select galaxy-wf-editPaste/Fetch Data
Paste the link(s) into the text field
Change Type (set all): from “Auto-detect” to laz
Press Start
Close the window
Comment: Why laz for a LAS file?
The Standardization reads the LAS and LAZ (LAS being a compressed LAZ file) content correctly and writes a real LAZ file for all later steps.
You can also select Choose from repository in Upload, open Recherche Data Gouv,
search for pic and open Données lidar acquises par drone au pied du Pic St Loup (34).
Note that there is 4 datafiles on the repository, only one file, Strip-20210804-150144_D.las, is used for the tuto.
In our test, this import stopped at 187 MB without an error, so check the file size
is 476,9 Mb afterwards.
Rename the dataset, which is named after the address, to Strip-20210804-150144_D.las.
Click on the galaxy-pencilpencil icon for the dataset to edit its attributes
In the central panel, change the Name field to Strip-20210804-150144_D.las
Click the Save button
Hands On: Import the prepared history
Open the history Pic Saint Loup
and select Import this history at the top right. It contains file D.
Discover the 3Dtrees workflow
The following sections go through the 3Dtrees workflow step by step, from a raw point cloud to
individual trees.
3Dtrees.earth is a community building a global forest reference: researchers
share high-quality 3D forest data to advance science, AI and sustainability. It is part of
NFDI4Earth.
Scanners and processing software store point clouds in slightly different ways. The Standardization
tool checks the file header, spatial bounds, point density and coordinate reference system, and
writes a clean LAZ file that the following tools can rely on. It does not detect trees.
Hands On: Standardize file D
3DTrees: LAS/LAZ Standardization ( Galaxy version 1.2.1+galaxy1) with the following parameters:
The tool returns standardized (the point cloud used from now on), metadata (a JSON
summary) and convex_hull (the survey footprint as GeoJSON).
Quiz: Why standardize a point cloud?
For file D, the tool checks for example that the bounding box and point count in the header match
the points, that the coordinate reference system (RGF93 / Lambert-93) is valid and in metres, that
the points lie on land, and that the file follows the LAS/LAZ format conventions. It stores the
results in metadata (point count, bounding box, coordinate reference system and attributes,
before and after standardization) and the survey outline in convex_hull. Tree identifiers are
not part of this step; they come from the segmentation model.
Get a first impression with overview images
Before predicting trees, look at the data. The Overviews tool draws images that open directly in
Galaxy: top views show the extent of the survey and gaps in the canopy, section views show the
ground and the vegetation layers above it.
Hands On: Create and inspect overview images
3Dtrees: Overviews ( Galaxy version 1.2.0+galaxy1) with the following parameters:
param-file“Point Cloud Collection”: standardized (output of 3DTrees: LAS/LAZ Standardizationtool)
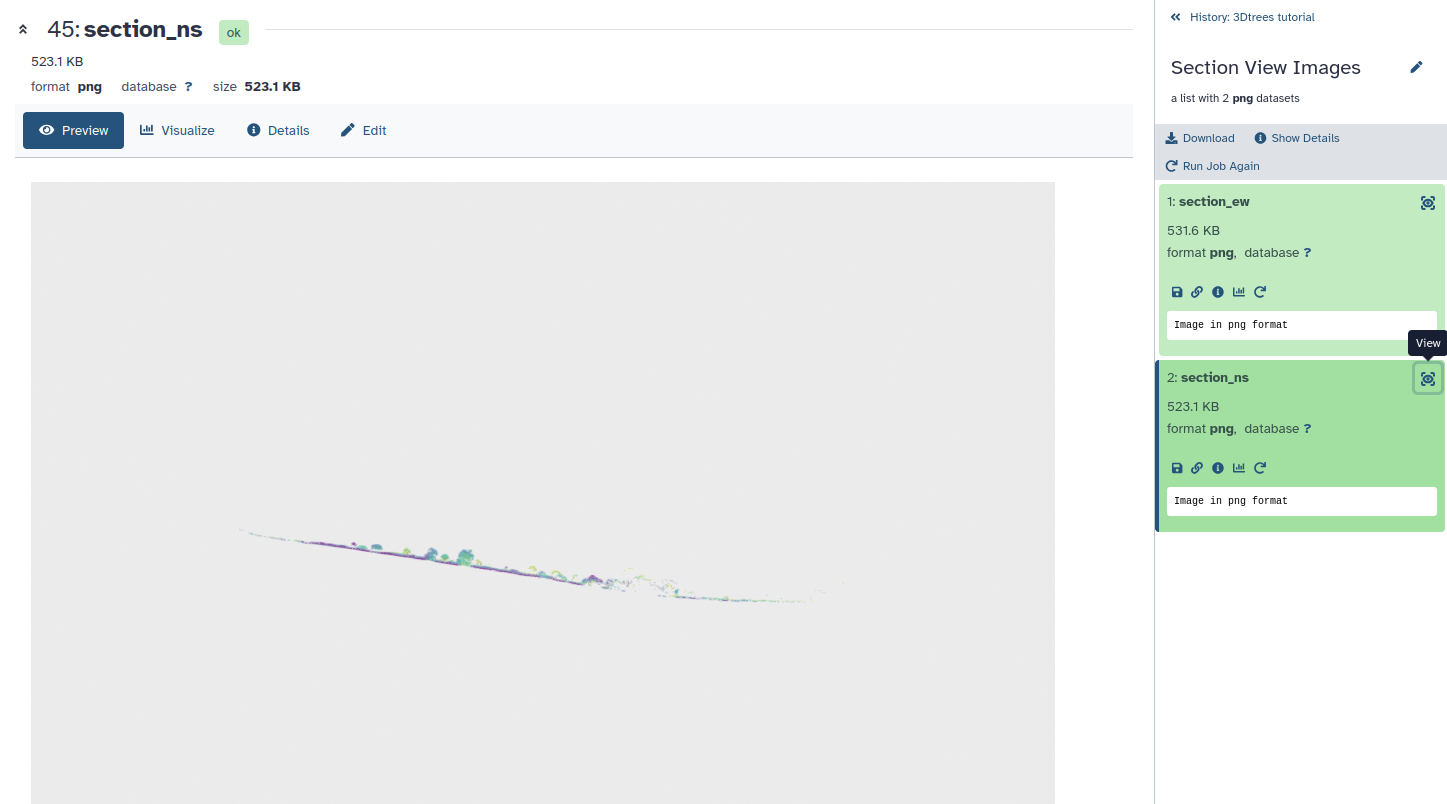
Open the images in the Top View Images and Section View Images collections (two each).
Figure 6: The north--south section view as Galaxy shows it
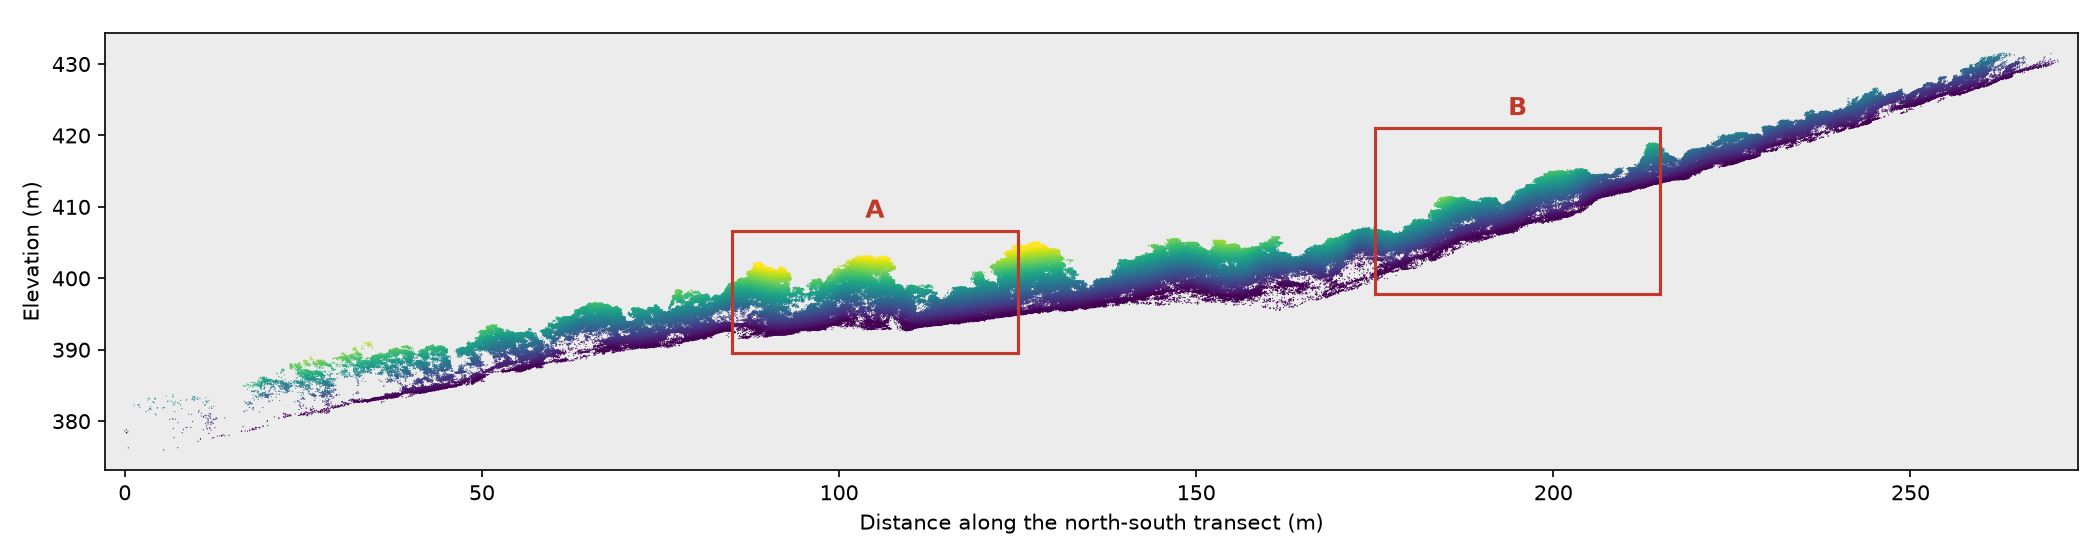
The forest is less than 15 m tall but the survey is about 270 m long, so in the preview the
section is a thin strip. Open the image at full size and zoom in. The images below show what you
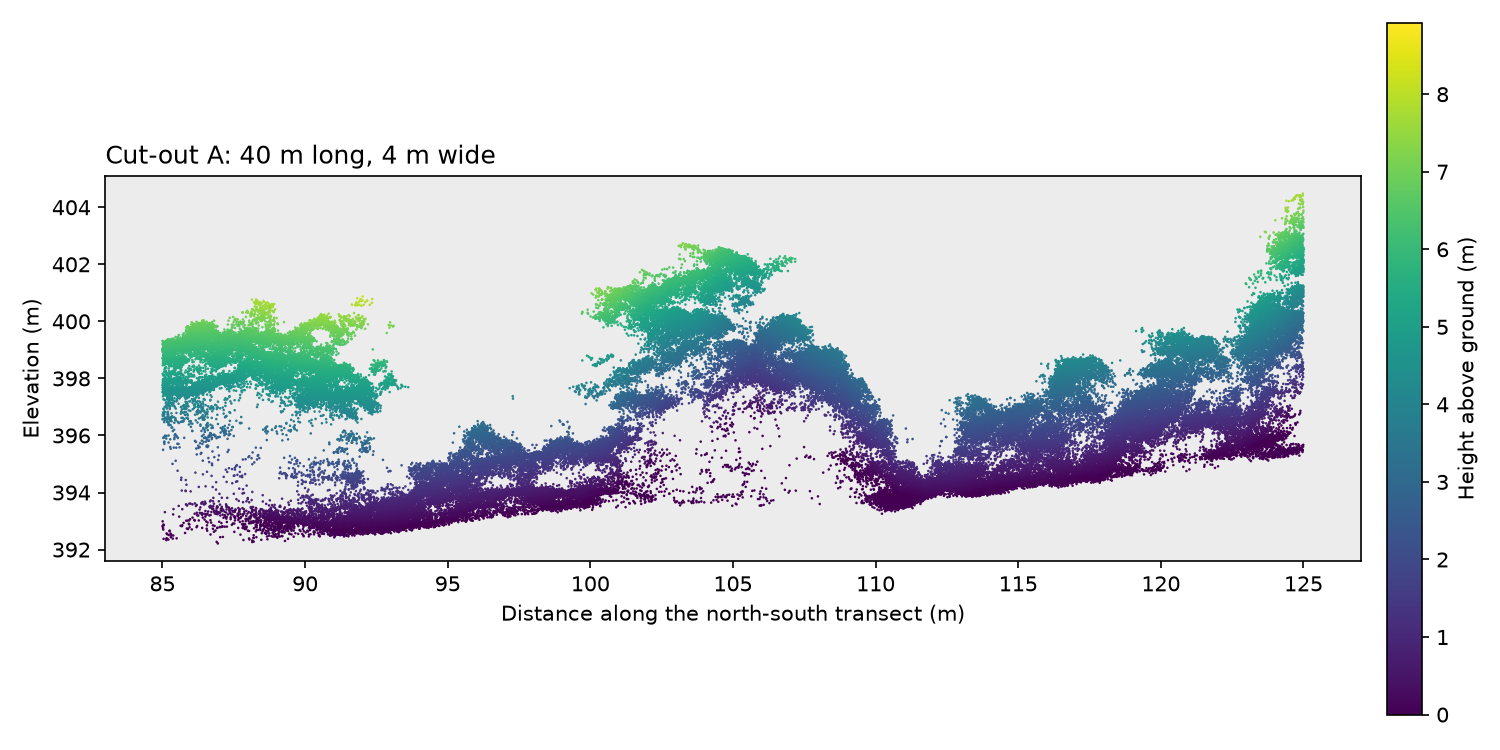
can see: the whole north–south section at true scale, and two close-ups.
Figure 7: The whole north--south section. Boxes A and B mark the close-upsOpen image in new tab
Figure 8: Close-up A: taller, separate crowns with gaps between themOpen image in new tab
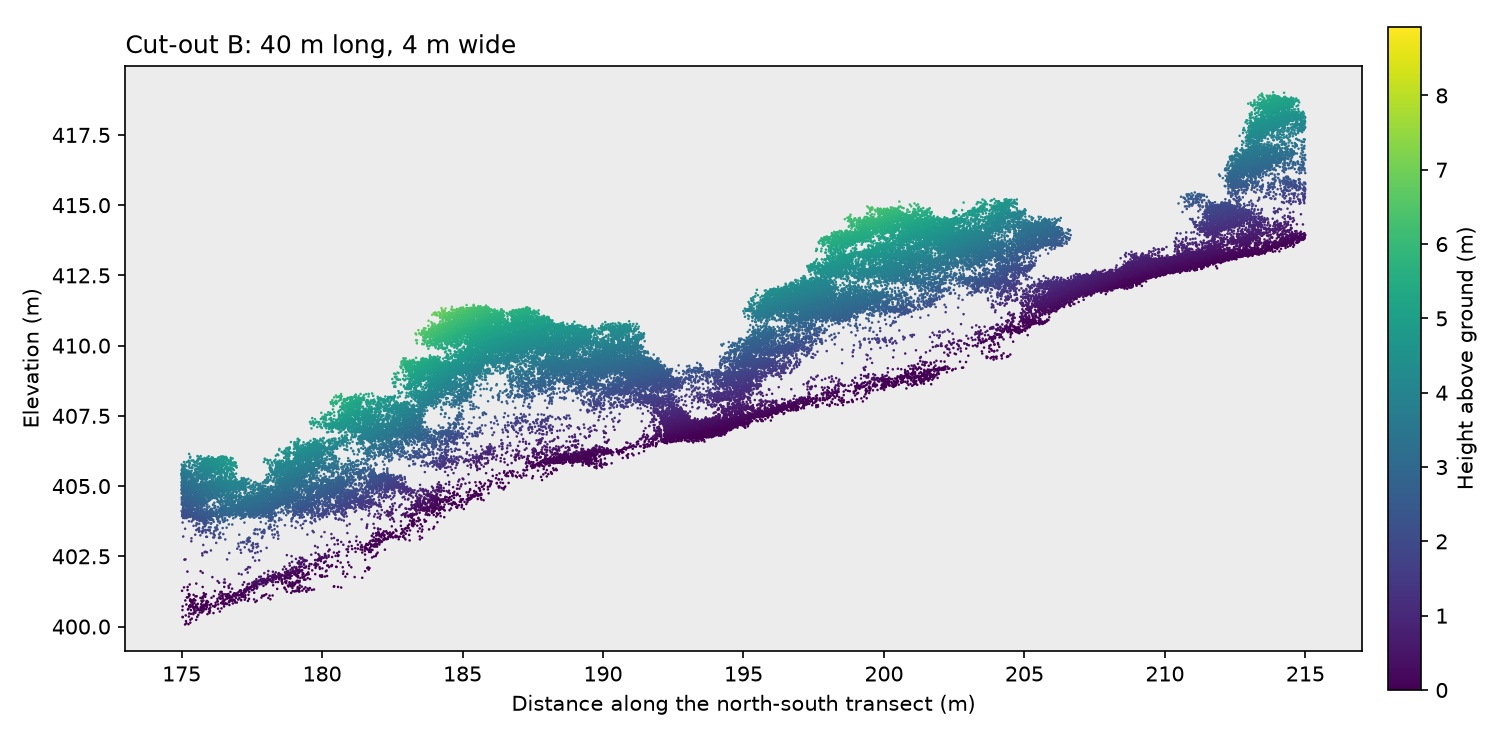
Figure 9: Close-up B: lower, continuous canopy on steeper ground
They were drawn outside Galaxy from file D. The full section is 10 m wide, like the default
Section Width of the Overviews tool; the close-ups use a 4 m slice so that fewer crowns
overlap. Colours show height above an estimated ground level.
Quiz: What can the overview tell you?
Gaps are easiest to see from above, layers from the side. Where crowns touch, as in close-up B,
there is no gap to mark where one tree ends, so separating trees is harder. Look at both areas
again in the final viewer.
Prepare the data for segmentation
SmartTile prepares the point cloud for the model in two ways:
Tiling: large surveys are cut into tiles, each with an overlapping buffer that gives the
model context around trees at the edge. File D is below the default Tiling threshold
(10000 MB), so it stays one tile.
Subsampling: the points are reduced to one per 10 cm voxel (a small cube). SegmentAnyTree
works at this resolution; the predictions are transferred back to every original point later.
Hands On: Tile and subsample
3DTrees: SmartTile ( Galaxy version 2.4.1+galaxy0) with the following parameters:
“Task”: Tile and subsample
param-file“Input LAZ/LAS files”: standardized (output of 3DTrees: LAS/LAZ Standardizationtool)
Figure 10: SmartTile set up to tile and subsample file D at 10 cm
The outputs are Tiles, output 1 (the subsampled tiles, input for SegmentAnyTree), a
Tiling preview map, and Tile bounds JSON (the tile layout, needed for the merge step).
Quiz: Why use overlapping processing tiles?
The buffer gives trees at the edge of a tile their surroundings, but it repeats points: a wider
buffer costs more time and makes it more likely that a tree is predicted twice. The merge step
later keeps each tree only once.
Identify individual trees with SegmentAnyTree
SegmentAnyTree is a deep-learning model trained on laser scans of many forest types
(Wielgosz et al. 2024). It adds two values to each point:
PredSemantic_SAT, the semantic class: vegetation or non-vegetation (for example ground).
PredInstance_SAT, the instance: an identifier shared by all points of one predicted tree.
Two neighbouring trees therefore have the same class but different instance identifiers.
Hands On: Predict trees
3Dtrees: SegmentAnyTree ( Galaxy version 1.2.3+galaxy0) with the following parameters:
param-collection“Input Dataset”: Tiles, output 1 (output of 3DTrees: SmartTiletool)
Select the input with the param-collectionDataset collection button, so that
Galaxy runs the model on every tile. The dimension names are the defaults.
The job needs a GPU. In our run it waited about an hour in the queue and then ran for about 20
minutes. The output collection is called Processed Files.
Quiz: Instance and semantic predictions
In this tutorial, the semantic class separates vegetation from non-vegetation, and the instance
identifies the individual tree. The instances are what make tree-based studies possible:
predicting the species of each tree, measuring tree height or crown size, or counting trees.
Combine the predictions and transfer them to the original points
SmartTile now puts the tiles back together. Using the tile layout, it keeps each tree only in the
tile that owns it and joins trees cut by tile borders. With Remap target set to the original
file, it then copies the predictions from the 10 cm points to every point of the full-resolution
file, which keeps all its original attributes.
Hands On: Merge the predictions
3DTrees: SmartTile ( Galaxy version 2.4.1+galaxy0) with the following parameters:
“Task”: Filter / merge segmented tiles
param-collection“Segmented tiles”: Processed Files (output of 3Dtrees: SegmentAnyTreetool)
“Voxel size of the segmented tiles (cm)”: 10
“Model”: SegmentAnyTree, ForestMamba or other point predictions
“Instance dimension”: PredInstance_SAT
param-file“Tile bounds JSON”: Tile bounds JSON (output of 3DTrees: SmartTiletool)
“Remap target”: Original files
param-file“Original LAZ/LAS files”: standardized (output of 3DTrees: LAS/LAZ Standardizationtool)
Figure 12: SmartTile set up to merge the predictions and transfer them to file D
The result, Originals with predictions, is file D at full resolution with both predictions
added. In our run this step took about 50 minutes.
Inspect the result in Potree
Potree shows the point cloud in 3D in your browser, so you can rotate and zoom to check the
predicted trees: are there missed trees, trees joined together, or trees split into pieces?
Hands On: Create and open the interactive view
3Dtrees: Potree Converter ( Galaxy version 1.2.1+galaxy0) with the following parameters:
param-file“Point Cloud Files”: Originals with predictions (output of 3DTrees: SmartTiletool)
Tree identifiers are just numbers, so neighbouring trees would get almost the same colour.
Special Coloring adds coloring_id_sat, which gives nearby trees clearly different colours.
Open the Potree Visualization output with its galaxy-eye eye icon. Loading can
take a minute. Each predicted tree has its own colour; points that belong to no tree are grey.
Figure 13: Predicted trees coloured by coloring_id_sat
Look at a few neighbouring trees from above and from the side, for example around close-ups A
and B. To see the vegetation/non-vegetation classes instead, open Scene in the menu on the left, click
the point cloud potree-vis, and set Attribute to PredSemantic_SAT.
Figure 14: Vegetation and non-vegetation points from PredSemantic_SAT
Quiz: Does the segmentation look plausible?
Colours that follow single crowns and differ between neighbours, and ground in the non-vegetation class,
suggest a good result. Straight cuts along tile borders or one colour across several crowns
suggest errors. A plausible picture is not proof, though: measuring accuracy needs trees that were
labelled independently, for example in the field.
Next steps
The tree labels are a starting point for measuring tree height, crown size or tree density. Other
3Dtrees tools in Galaxy go further:
3Dtrees: ForestMamba ( Galaxy version 1.0.0+galaxy0)
is an alternative tree segmentation model that also separates leaves from wood.
3Dtrees: DetailView ( Galaxy version 1.1.1+galaxy0)
predicts the species of segmented trees, within the classes it was trained on.
Conclusion
You turned one drone LiDAR file into a point cloud in which every point carries a predicted class
and, for tree points, a tree identifier, and you checked the result in 3D. The predictions depend
on forest type, point density and survey method, so always inspect them before using them for
ecological analysis.
Acknowledgements
This work is part of the collaboration between the EOSC node Data Terra and NFDI4Earth.
Alleaume, S., and A. Jolivot, 2021 Données lidar acquises par drone au pied du Pic St Loup (34). Etalab Open License 2.0. 10.15454/DMYWPB
Adeline, K., J. B. Féret, H. Clenet, J. M. Limousin, J. M. Ourcival et al., 2024 Multi-scale datasets for monitoring Mediterranean oak forests from optical remote sensing during the SENTHYMED/MEDOAK experiment in the north of Montpellier (France). Data in Brief 53: 110185. 10.1016/j.dib.2024.110185
Wielgosz, M., S. Puliti, B. Xiang, K. Schindler, and R. Astrup, 2024 SegmentAnyTree: A sensor and platform agnostic deep learning model for tree segmentation using laser scanning data. Remote Sensing of Environment 313: 114367. 10.1016/j.rse.2024.114367
Gerberding, K., and others, 2026 3Dtrees: title to be added on publication. Manuscript in preparation. Placeholder: replace with the published reference.. https://3dtrees.earth
Feedback
Did you use this material as an instructor? Feel free to give us feedback on how it went.
Did you use this material as a learner or student? Click the form below to leave feedback.
Hiltemann, Saskia, Rasche, Helena et al., 2023 Galaxy Training: A Powerful Framework for Teaching! PLOS Computational Biology 10.1371/journal.pcbi.1010752
Batut et al., 2018 Community-Driven Data Analysis Training for Biology Cell Systems 10.1016/j.cels.2018.05.012
@misc{climate-3dtrees,
author = "Kilian Gerberding and Marie Josse",
	title = "3Dtrees: From LiDAR point clouds to individual trees (Galaxy Training Materials)",
	year = "",
	month = "",
	day = "",
	url = "\url{https://training.galaxyproject.org/training-material/topics/climate/tutorials/3dtrees/tutorial.html}",
	note = "[Online; accessed TODAY]"
}
@article{Hiltemann_2023,
	doi = {10.1371/journal.pcbi.1010752},
	url = {https://doi.org/10.1371%2Fjournal.pcbi.1010752},
	year = 2023,
	month = {jan},
	publisher = {Public Library of Science ({PLoS})},
	volume = {19},
	number = {1},
	pages = {e1010752},
	author = {Saskia Hiltemann and Helena Rasche and Simon Gladman and Hans-Rudolf Hotz and Delphine Larivi{\`{e}}re and Daniel Blankenberg and Pratik D. Jagtap and Thomas Wollmann and Anthony Bretaudeau and Nadia Gou{\'{e}} and Timothy J. Griffin and Coline Royaux and Yvan Le Bras and Subina Mehta and Anna Syme and Frederik Coppens and Bert Droesbeke and Nicola Soranzo and Wendi Bacon and Fotis Psomopoulos and Crist{\'{o}}bal Gallardo-Alba and John Davis and Melanie Christine Föll and Matthias Fahrner and Maria A. Doyle and Beatriz Serrano-Solano and Anne Claire Fouilloux and Peter van Heusden and Wolfgang Maier and Dave Clements and Florian Heyl and Björn Grüning and B{\'{e}}r{\'{e}}nice Batut and},
	editor = {Francis Ouellette},
	title = {Galaxy Training: A powerful framework for teaching!},
	journal = {PLoS Comput Biol}
}
Funding
These individuals or organisations provided funding support for the development of this resource
 Kilian Gerberding

 Marie Josse
 Yvan Le Bras
 Pauline Seguineau
Questions:
Open image in new tab
Open image in new tab
Open image in new tab

Open image in new tab
Open image in new tab
 Open image in new tab
 Open image in new tab
 Open image in new tab
 Open image in new tab
Open image in new tab
Open image in new tab
Open image in new tab
Open image in new tab
 Open image in new tab
 Open image in new tab
 Open image in new tab